Skip Navigation LinksBLLMapsTables

Childhood lead poisoning prevention branch

California Blood Lead Data, 2018

Page Contents:

ā€‹Number of Individual Children Screened for Lead, by California Local Health Jurisdiction and Highest Level, 2018 (Table)

ā€‹Number of Individual Children Screened for Lead, by California Local Health Jurisdiction and Highest Level, 2018 (Table)

Local Health JurisdictionAge Group (Years)Blood Lead Level (BLL)
<4.5 n
BLL <4.5 % (row)BLL ā‰„4.5 to <9.5 nBLL ā‰„4.5 to <9.5
% (row)
BLL
ā‰„9.5 n
BLL
ā‰„9.5
% (row)
Totals
AlamedaAge <615,94597.78%3001.84%620.38%16,307
ā€‹Age 6 to <212,31697.03%562.35%150.63%2,387
ā€‹Local Total Age <2118,26197.68%3561.90%770.41%18,694
AlpineAge <6SuppressedSuppressedSuppressedSuppressedSuppressedSuppressedSuppressed
ā€‹Age 6 to <21SuppressedSuppressedSuppressedSuppressedSuppressedSuppressedSuppressed
 Local Total Age <21SuppressedSuppressedSuppressedSuppressedSuppressedSuppressedSuppressed
AmadorAge <6SuppressedSuppressedSuppressedSuppressedSuppressedSuppressedSuppressed
ā€‹Age 6 to <21SuppressedSuppressedSuppressedSuppressedSuppressedSuppressedSuppressed
ā€‹Local Total Age <21SuppressedSuppressedSuppressedSuppressedSuppressedSuppressed442
BerkeleyAge <661698.25%101.59%10.16%627
ā€‹Age 6 to <2157100.00%00.00%00.00%57
 Local Total Age <2167398.39%101.46%10.15%684
ButteAge <61,81799.07%150.82%20.11%1,834
ā€‹Age 6 to <214897.96%12.04%00.00%49
ā€‹Local Total Age <211,86599.04%160.85%20.11%1,883
CalaverasAge <6SuppressedSuppressedSuppressedSuppressedSuppressedSuppressedSuppressed
ā€‹Age 6 to <21SuppressedSuppressedSuppressedSuppressedSuppressedSuppressedSuppressed
 Local Total Age <21SuppressedSuppressedSuppressedSuppressedSuppressedSuppressed339
ColusaAge <6SuppressedSuppressedSuppressedSuppressedSuppressedSuppressedSuppressed
ā€‹Age 6 to <21SuppressedSuppressedSuppressedSuppressedSuppressedSuppressedSuppressed
ā€‹Local Total Age <21SuppressedSuppressedSuppressedSuppressedSuppressedSuppressed376
Contra CostaAge <67,06298.48%851.19%240.33%7,171
ā€‹Age 6 to <2168496.07%233.23%50.70%712
 Local Total Age <217,74698.26%1081.37%290.37%7,883
Del NorteAge <6SuppressedSuppressedSuppressedSuppressedSuppressedSuppressedSuppressed
ā€‹Age 6 to <21SuppressedSuppressedSuppressedSuppressedSuppressedSuppressedSuppressed
ā€‹Local Total Age <21SuppressedSuppressedSuppressedSuppressedSuppressedSuppressed219
El DoradoAge <652196.13%183.32%30.55%542
ā€‹Age 6 to <218098.77%11.23%00.00%81
 Local Total Age <2160196.47%193.05%30.48%623
FresnoAge <615,22197.53%3202.05%660.42%15,607
ā€‹Age 6 to <211,92898.52%251.28%40.20%1,957
ā€‹Local Total Age <2117,14997.64%3451.96%700.40%17,564


Glenn

Age <6SuppressedSuppressedSuppressedSuppressedSuppressedSuppressedSuppressed
ā€‹Age 6 to <21SuppressedSuppressedSuppressedSuppressedSuppressedSuppressedSuppressed
 Local Total Age <21SuppressedSuppressedSuppressedSuppressedSuppressedSuppressed393
HumboldtAge <61,68692.33%1226.68%180.99%1,826
ā€‹Age 6 to <217893.98%56.02%00.00%83
ā€‹Local Total Age <211,76492.40%1276.65%180.94%1,909
ImperialAge <64,44798.28%681.50%100.22%4,525
ā€‹Age 6 to <2147798.96%51.04%00.00%482
 Local Total Age <214,92498.34%731.46%100.20%5,007
InyoAge <6SuppressedSuppressedSuppressedSuppressedSuppressedSuppressedSuppressed
ā€‹Age 6 to <21SuppressedSuppressedSuppressedSuppressedSuppressedSuppressedSuppressed
ā€‹Local Total Age <21SuppressedSuppressedSuppressedSuppressedSuppressedSuppressedSuppressed
KernAge <616,99898.20%2561.48%560.32%17,310
ā€‹Age 6 to <211,32398.07%221.63%40.30%1,349
 Local Total Age <2118,32198.19%2781.49%600.32%18,659
KingsAge <62,19497.29%542.39%70.31%2,255
ā€‹Age 6 to <216997.18%11.41%11.41%71
ā€‹Local Total Age <212,26397.29%552.36%80.34%2,326
LakeAge <6SuppressedSuppressedSuppressedSuppressedSuppressedSuppressed553
ā€‹Age 6 to <21SuppressedSuppressedSuppressedSuppressedSuppressedSuppressed527
 Local Total Age <21SuppressedSuppressedSuppressedSuppressedSuppressedSuppressed580
LassenAge <6SuppressedSuppressedSuppressedSuppressedSuppressedSuppressedSuppressed
ā€‹Age 6 to <21SuppressedSuppressedSuppressedSuppressedSuppressedSuppressedSuppressed
ā€‹Local Total Age <21SuppressedSuppressedSuppressedSuppressedSuppressedSuppressed67
Long BeachAge <65,68999.18%370.65%100.17%5,736
ā€‹Age 6 to <2144299.33%20.45%10.22%445
 Local Total Age <216,13199.19%390.63%110.18%6,181
Los AngelesAge <6140,14198.67%1,5721.11%3100.22%142,023
ā€‹Age 6 to <2118,48298.39%2421.29%600.32%18,784
ā€‹Local Total Age <21158,62398.64%1,8141.13%3700.23%160,807
MaderaAge <63,89898.38%541.36%100.25%3,962
ā€‹Age 6 to <2147799.17%30.62%10.21%481
 Local Total Age <214,37598.47%571.28%110.25%4,443
MarinAge <61,69099.12%90.53%60.35%1,705
ā€‹Age 6 to <2120598.56%20.96%10.48%208
ā€‹Local Total Age <211,89599.06%110.58%70.37%1,913
MariposaAge <6SuppressedSuppressedSuppressedSuppressedSuppressedSuppressedSuppressed
ā€‹Age 6 to <21SuppressedSuppressedSuppressedSuppressedSuppressedSuppressedSuppressed
 Local Total Age <21SuppressedSuppressedSuppressedSuppressedSuppressedSuppressed63
MendocinoAge <696796.03%SuppressedSuppressedSuppressedSuppressed1,007
ā€‹Age 6 to <21SuppressedSuppressedSuppressedSuppressedSuppressedSuppressed50
ā€‹Local Total Age <21SuppressedSuppressedSuppressedSuppressedSuppressedSuppressed1,057
MercedAge <63,70698.15%651.72%50.13%3,776
ā€‹Age 6 to <2116098.16%31.84%00.00%163
 Local Total Age <213,86698.15%681.73%50.13%3,939
ModocAge <6SuppressedSuppressedSuppressedSuppressedSuppressedSuppressedSuppressed
ā€‹Age 6 to <21SuppressedSuppressedSuppressedSuppressedSuppressedSuppressedSuppressed
ā€‹Local Total Age <21SuppressedSuppressedSuppressedSuppressedSuppressedSuppressedSuppressed
MonoAge <6SuppressedSuppressedSuppressedSuppressedSuppressedSuppressedSuppressed
ā€‹Age 6 to <21SuppressedSuppressedSuppressedSuppressedSuppressedSuppressedSuppressed
 Local Total Age <21SuppressedSuppressedSuppressedSuppressedSuppressedSuppressedSuppressed
MontereyAge <67,35498.20%1021.36%330.44%7,489
ā€‹Age 6 to <2177496.15%222.73%91.12%805
ā€‹Local Total Age <218,12898.00%1241.50%420.51%8,294
NapaAge <689399.11%70.78%10.11%901
ā€‹Age 6 to <213895.00%25.00%00.00%40
 Local Total Age <2193198.94%90.96%10.11%941
NevadaAge <627096.09%SuppressedSuppressedSuppressedSuppressed281
ā€‹Age 6 to <21SuppressedSuppressedSuppressedSuppressedSuppressedSuppressed37
ā€‹Local Total Age <21SuppressedSuppressedSuppressedSuppressedSuppressedSuppressed318
OrangeAge <632,09498.98%2710.84%610.19%32,426
ā€‹Age 6 to <213,57099.22%230.64%50.14%3,598
 Local Total Age <2135,66499.00%2940.82%660.18%36,024
PasadenaAge <61,34697.89%251.82%40.29%1,375
ā€‹Age 6 to <21132100.00%00.00%00.00%132
ā€‹Local Total Age <211,47898.08%251.66%40.27%1,507
PlacerAge <698799.00%80.80%20.20%997
ā€‹Age 6 to <2110696.36%32.73%10.91%110
 Local Total Age <211,09398.74%110.99%30.27%1,107
PlumasAge <6SuppressedSuppressedSuppressedSuppressedSuppressedSuppressedSuppressed
ā€‹Age 6 to <21SuppressedSuppressedSuppressedSuppressedSuppressedSuppressedSuppressed
ā€‹Local Total Age <21SuppressedSuppressedSuppressedSuppressedSuppressedSuppressedSuppressed
RiversideAge <633,86699.47%1540.45%260.08%34,046
ā€‹Age 6 to <211,86499.04%130.69%50.27%1,882
 Local Total Age <2135,73099.45%1670.46%310.09%35,928
SacramentoAge <614,49096.27%4312.86%1300.86%15,051
ā€‹Age 6 to <211,40181.08%27916.15%482.78%1,728
ā€‹Local Total Age <2115,89194.71%7104.23%1781.06%16,779
San BenitoAge <6SuppressedSuppressedSuppressedSuppressedSuppressedSuppressed706
ā€‹Age 6 to <21SuppressedSuppressedSuppressedSuppressedSuppressedSuppressed35
 Local Total Age <21SuppressedSuppressedSuppressedSuppressedSuppressedSuppressed741
San BernardinoAge <632,83299.24%2090.63%420.13%33,083
ā€‹Age 6 to <212,78099.29%150.54%50.18%2,800
ā€‹Local Total Age <2135,61299.24%2240.62%470.13%35,883
San DiegoAge <638,63998.63%4351.11%1020.26%39,176
ā€‹Age 6 to <211,81995.34%713.72%180.94%1,908
 Local Total Age <2140,45898.48%5061.23%1200.29%41,084
San FranciscoAge <68,07398.28%1091.33%320.39%8,214
ā€‹Age 6 to <2189299.22%60.67%10.11%899
ā€‹Local Total Age <218,96598.38%1151.26%330.36%9,113
San JoaquinAge <610,42698.56%1211.14%310.29%10,578
ā€‹Age 6 to <2160397.57%132.10%20.32%618
 Local Total Age <2111,02998.51%1341.20%330.29%11,196
San Luis ObispoAge <61,27999.07%90.70%30.23%1,291
ā€‹Age 6 to <214195.35%24.65%00.00%43
ā€‹Local Total Age <211,32098.95%110.82%30.22%1,334
San MateoAge <65,93898.04%1001.65%190.31%6,057
ā€‹Age 6 to <2146099.14%30.65%10.22%464
 Local Total Age <216,39898.11%1031.58%200.31%6,521
Santa BarbaraAge <64,49998.60%531.16%110.24%4,563
ā€‹Age 6 to <2121797.75%52.25%00.00%222
ā€‹Local Total Age <214,71698.56%581.21%110.23%4,785
Santa ClaraAge <618,54298.53%2081.11%690.37%18,819
ā€‹Age 6 to <212,22596.87%462.00%261.13%2,297
 Local Total Age <2120,76798.35%2541.20%950.45%21,116
Santa CruzAge <62,21497.96%381.68%80.35%2,260
ā€‹Age 6 to <2127696.17%103.48%10.35%287
ā€‹Local Total Age <212,49097.76%481.88%90.35%2,547
ShastaAge <653497.98%81.47%30.55%545
ā€‹Age 6 to <213597.22%12.78%00.00%36
 Local Total Age <2156997.93%91.55%30.52%581
SierraAge <6SuppressedSuppressedSuppressedSuppressedSuppressedSuppressedSuppressed
ā€‹Age 6 to <21SuppressedSuppressedSuppressedSuppressedSuppressedSuppressedSuppressed
ā€‹Local Total Age <21SuppressedSuppressedSuppressedSuppressedSuppressedSuppressedSuppressed
SiskiyouAge <6SuppressedSuppressedSuppressedSuppressedSuppressedSuppressedSuppressed
ā€‹Age 6 to <21SuppressedSuppressedSuppressedSuppressedSuppressedSuppressedSuppressed
 Local Total Age <21SuppressedSuppressedSuppressedSuppressedSuppressedSuppressed144
SolanoAge <64,47097.05%1152.50%210.46%4,606
ā€‹Age 6 to <2123395.88%93.70%10.41%243
ā€‹Local Total Age <214,70396.99%1242.56%220.45%4,849
SonomaAge <62,78298.90%250.89%60.21%2,813
ā€‹Age 6 to <2126398.50%41.50%00.00%267
 Local Total Age <213,04598.86%290.94%60.19%3,080
StanislausAge <67,44898.22%1091.44%260.34%7,583
ā€‹Age 6 to <2158391.96%416.47%101.58%634
ā€‹Local Total Age <218,03197.74%1501.83%360.44%8,217
SutterAge <61,18898.34%SuppressedSuppressedSuppressedSuppressed1,208
ā€‹Age 6 to <21SuppressedSuppressedSuppressedSuppressedSuppressedSuppressed62
 Local Total Age <21SuppressedSuppressedSuppressedSuppressedSuppressedSuppressed1,270
TehamaAge <61,55098.92%SuppressedSuppressedSuppressedSuppressed1,567
ā€‹Age 6 to <21SuppressedSuppressedSuppressedSuppressedSuppressedSuppressed88
ā€‹Local Total Age <21SuppressedSuppressedSuppressedSuppressedSuppressedSuppressed1,655
TrinityAge <6SuppressedSuppressedSuppressedSuppressedSuppressedSuppressedSuppressed
ā€‹Age 6 to <21SuppressedSuppressedSuppressedSuppressedSuppressedSuppressedSuppressed
 Local Total Age <21SuppressedSuppressedSuppressedSuppressedSuppressedSuppressedSuppressed
TulareAge <65,71198.04%981.68%160.27%5,825
ā€‹Age 6 to <2139998.28%51.23%20.49%406
ā€‹Local Total Age <216,11098.06%1031.65%180.29%6,231
TuolumneAge <6SuppressedSuppressedSuppressedSuppressedSuppressedSuppressedSuppressed
ā€‹Age 6 to <21SuppressedSuppressedSuppressedSuppressedSuppressedSuppressedSuppressed
 Local Total Age <21SuppressedSuppressedSuppressedSuppressedSuppressedSuppressed351
VenturaAge <67,00999.31%390.55%100.14%7,058
ā€‹Age 6 to <2148698.78%51.02%10.20%492
ā€‹Local Total Age <217,49599.27%440.58%110.15%7,550
YoloAge <62,22197.28%512.23%110.48%2,283
ā€‹Age 6 to <217797.47%22.53%00.00%79
 Local Total Age <212,29897.29%532.24%110.47%2,362
YubaAge <6SuppressedSuppressedSuppressedSuppressedSuppressedSuppressedSuppressed
ā€‹Age 6 to <21SuppressedSuppressedSuppressedSuppressedSuppressedSuppressedSuppressed
 Local Total Age <2188798.56%SuppressedSuppressedSuppressedSuppressed900
CLPPB (includes tests with unknown jurisdictions)Age <621100.00%00.00%00.00%21
ā€‹Age 6 to <213100.00%00.00%00.00%3
ā€‹Local Total Age <2124100.00%00.00%00.00%24
California TotalsAge <6473,81398.52%5,8501.22%1,2910.27%480,954
ā€‹Age 6 to <21
46,64397.46%9842.06%2320.48%47,859
 Local Total Age <21520,45698.42%6,8341.29%1,5230.29%528,813

  • Data are from the RASSCLE surveillance database archive of 4/3/2019.
  • Each individual is counted only once, using their highest BLL during 2018.
  • Measures are in mcg/dL of whole blood and include arterial, cord, venous, capillary, and unknown samples. Not all elevated capillary samples are confirmed by a follow-up venous sample.
  • Results later determined to be false positive and errors have been excluded.
  • All results of blood lead analyses are reportable under California law, and the State works to ensure complete reporting. Results that are not submitted to the State, however, would not be included here.
  • Those BLLs reported from the analyzing laboratory as "<5 mcg/dL" are included in the category "BLL <4.5 mcg/dL."
  • If an individual moved between two jurisdictions, then the child's jurisdiction at the time of their highest BLL is the one counted. 
  • Patient jurisdiction is determined by geocoding the address associated with the child's highest BLL and spatially joining it to a jurisdiction boundary layer. This analysis used the Web Mercator Auxiliary Sphere projection.
  • Data are suppressed for local health jurisdictions that did not have enough blood lead tests in 2018 to meet the California Health and Human Services Agency's Data Deā€‘Identification Guidelines for public release. However, the California Totals include the data from suppressed jurisdictions.

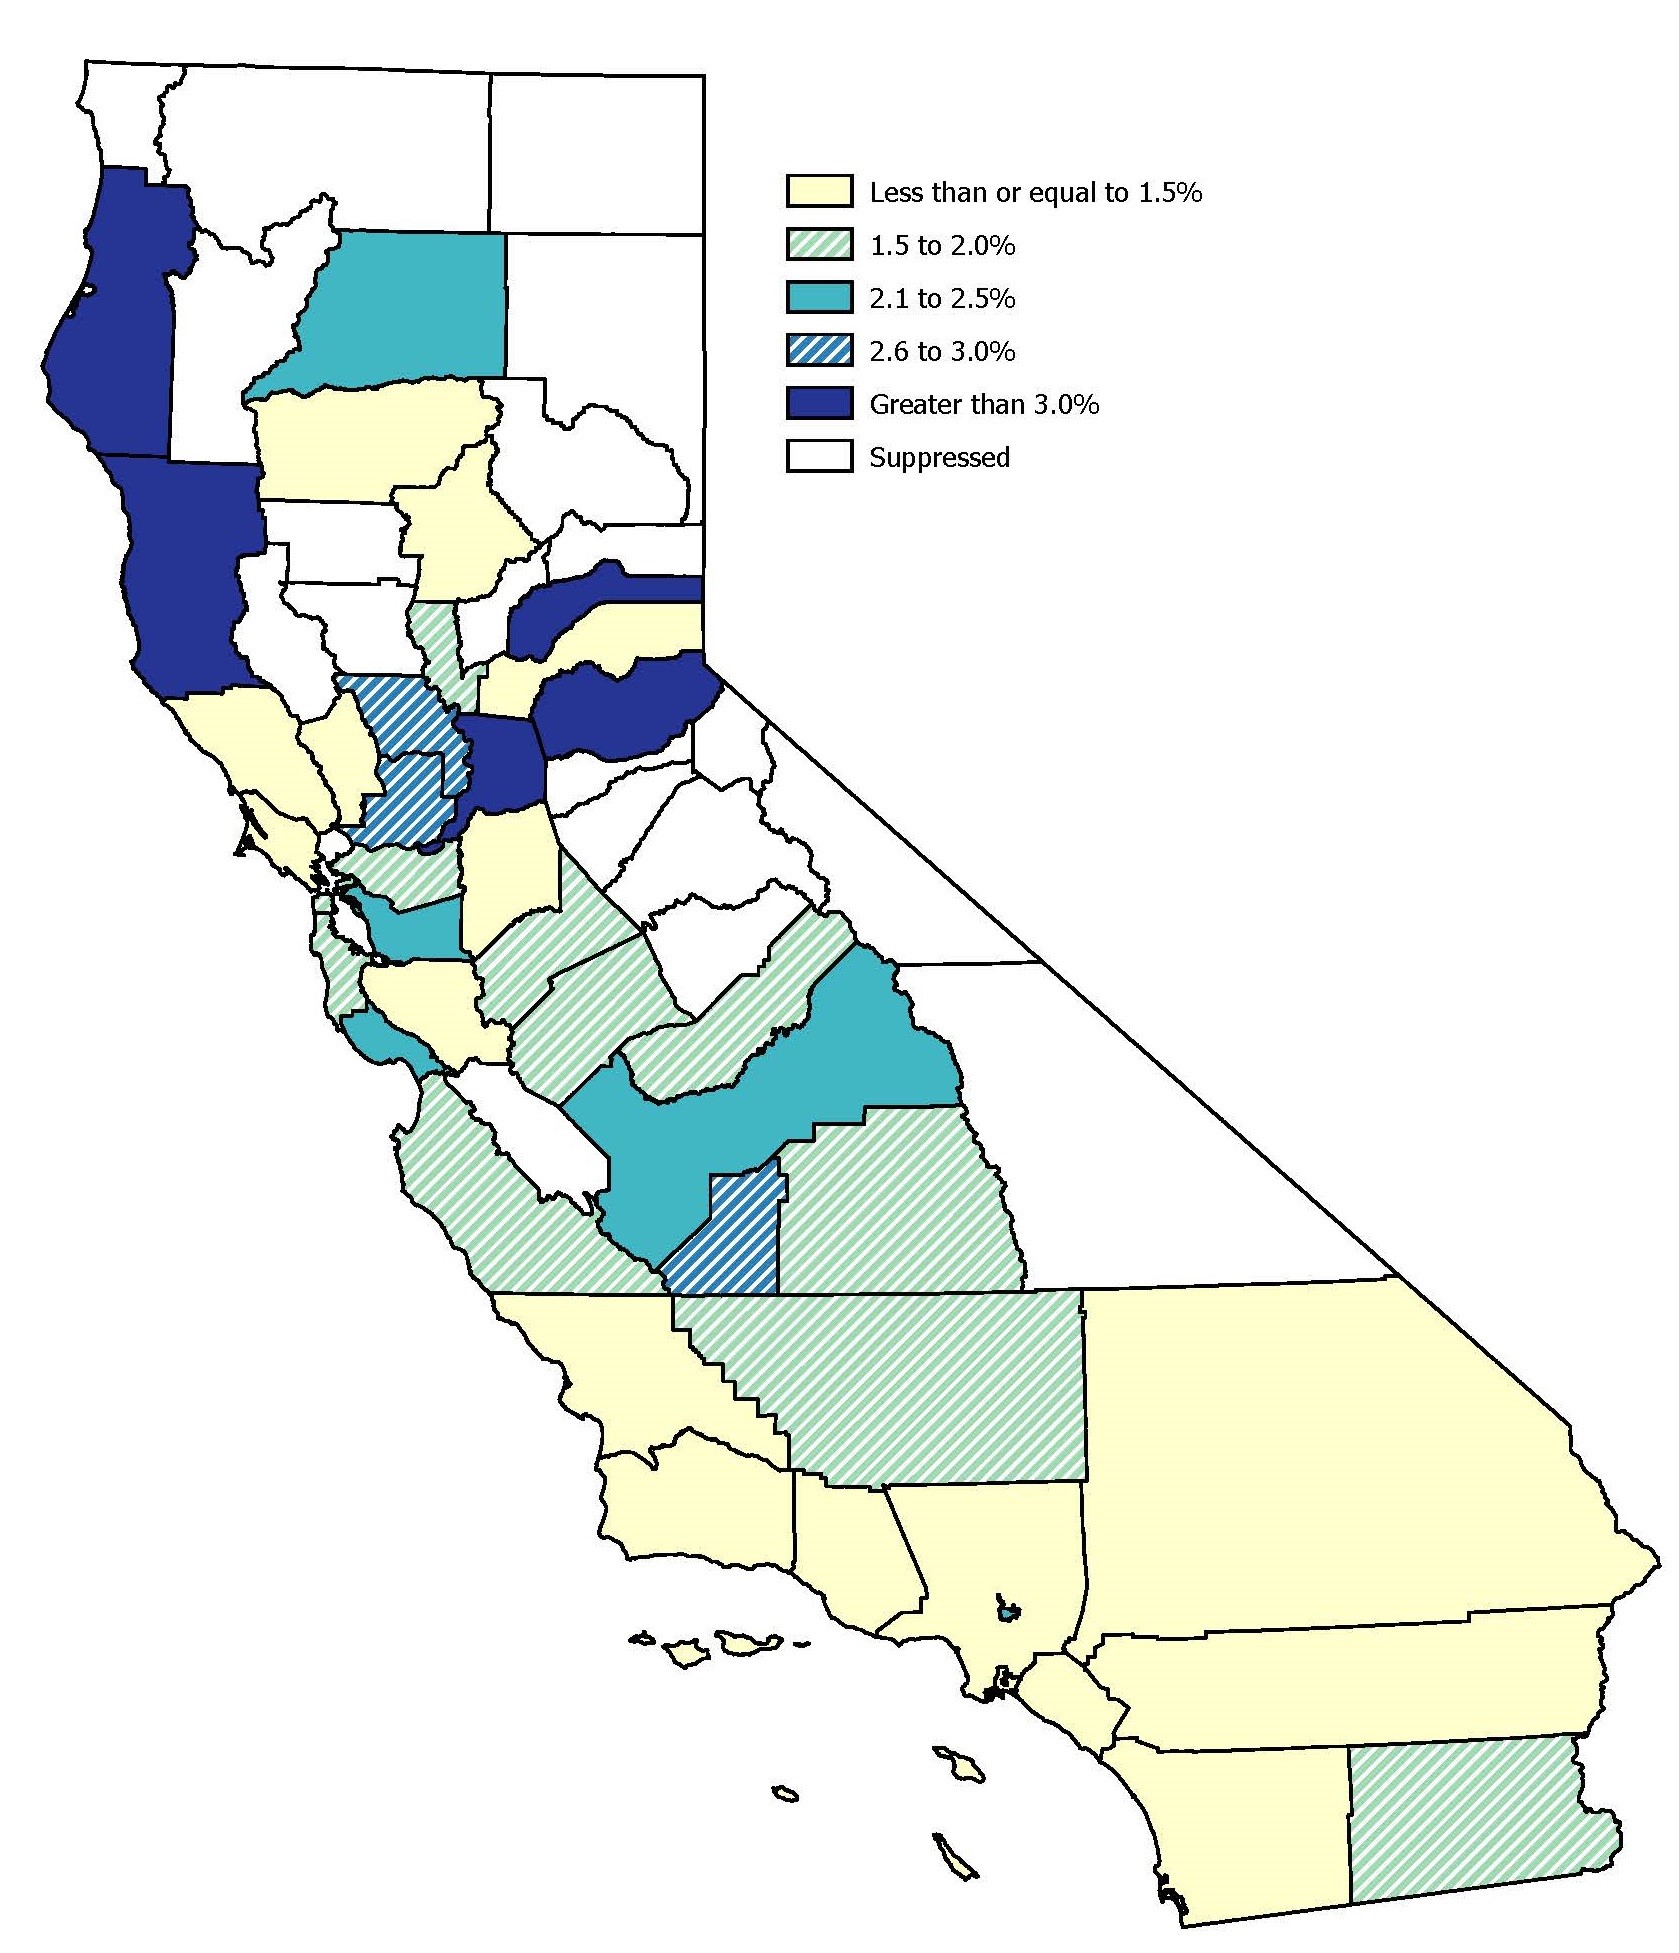
Map 1: Percent of Children Under 6 Years Old with a Blood Lead Level of 4.5 mcg/dL or Greater, by California Local Health Jurisdiction, 2018

Percent of children under 6 with a BLL of 4

Data are suppressed for local health jurisdictions that did not meet the California Health and Human Service Agency's Data De-Identification Guidelines for public release.

Suppressed jurisdictions include Alpine, Amador, Calaveras, Colusa, Del Norte, Glenn, Inyo, Lake, Lassen, Mariposa, Modoc, Mono, Plumas, San Benito, Sierra, Siskiyou, Trinity, Tuolumne and Yuba.

  •  ā€‹ā€‹Data are from the RASSCLE surveillance database archive of 4/3/2019.
  • Each individual is counted only once, using their highest blood lead level (BLL) during 2018.
  • Measures are in mcg/dL (micrograms per deciliter) of whole blood and include arterial, cord, venous, capillary and unknown samples. Not all elevated capillary samples are confirmed by a follow-up venous sample.
  • Results later determined to be false positive and errors have been excluded.
  • All results of blood lead analyses are reportable under California law, and the State works to ensure complete reporting. Results that are not submitted to the State, however, would not be included here.
  • Those BLLs reported from the analyzing laboratory as "< 5 mcg/dL" are included in the category "BLL < 4.5 mcg/dL".
  • If an individual moved between two jurisdictions, then the child's jurisdiction at the time of their highest BLL is the one counted.  
  • Patient jurisdiction is determined by using a geocoded county boundary layer i.e. the X and Y coordinates projected using Web Mercator Auxiliary Sphere 1984.
  • Refer to Table 1 for data table. 

Table 1. California Local Health Jurisdictions, by Percent of Children Under 6 Years Old with a Blood Lead Level of 4.5 mcg/dL or Greater, in Descending Order, with Estimates of Children in Medi-Cal and Total Population, 2018

Local Health JurisdictionBLL < 4.5 nBLL < 4.5 % (row)BLL ā‰„ 4.5 nBLL ā‰„ 4.5 % (row)Total number of children under 6 screenedEstimate of the number of children under 6 in Medi-CalEstimate of the number of children under 6
Humboldt1,68692.33%1407.67%1,8265,359 8,387
Mendocino96796.03%403.97%1,007Cannot estimate 6,603
Nevada27096.09%113.91%281Cannot estimate 4,776
El Dorado52196.13%213.87%542
2,968 9,560
Sacramento14,49096.27%5613.73%15,051
56,050 118,765
Solano4,47097.05%1362.95%4,606
14,188 32,701
Yolo2,22197.28%622.72%2,2835,624
14,183
Kings2,19497.29%612.71%2,2555,772 14,020
Fresno15,22197.53%3862.47%15,607
59,131 90,338
Alameda15,94597.78%3622.22%16,307
32,969 107,004
Pasadena1,34697.89%292.11%1,375Cannot estimate 10,264
Santa Cruz2,21497.96%462.04%2,260
8,759 17,250
Shasta53497.98%112.02%545
6,961 12,595
San Mateo5,93898.04%1191.96%6,057
12,519 52,353
Tulare5,71198.04%1141.96%5,825
25,409
43,640
Suppressed jurisdictions4,53998.14%861.86%4,625Cannot estimate 39,237
Merced3,70698.15%701.85%3,776
18,572 25,692
Monterey7,35498.20%1351.80%7,489Cannot estimate 37,482
Kern16,99898.20%3121.80%17,31049,515 81,996
Stanislaus7,44898.22%1351.78%7,583
25,873 46,011
Berkeley61698.25%111.75%627Cannot estimate 8,477
Imperial4,44798.28%781.72%4,52511,271 18,886
San Francisco8,07398.28%1411.72%8,21412,724 51,719
Sutter1,18898.34%201.66%1,208Cannot estimate 8,125
Madera3,89898.38%641.62%3,9629,550
13,170
Contra Costa7,06298.48%1091.52%7,17125,272
75,481
Santa Clara18,54298.53%2771.47%18,81940,116
141,833
San Joaquin10,42698.56%1521.44%10,578
33,027 60,278
Santa Barbara4,49998.60%
641.40%4,56317,600
33,325
San Diego38,63998.63%5371.37%39,17687,710
254,756
Los Angeles140,14198.67%1,8821.33%142,023352,592 686,779
Sonoma2,78298.90%311.10%2,81311,596
28,089
Tehama1,55098.92%171.08%1,567Cannot estimate 4,918
Orange32,09498.98%3321.02%32,42694,529
231,137
Placer98799.00%101.00%997
5,456
23,106
San Luis Obispo1,27999.07%120.93%1,2915,682
15,494
Butte1,81799.07%170.93%1,834
8,034
14,930
Napa89399.11%80.89%9013,419 8,781
Marin1,69099.12%150.88%1,705
3,858 13,667
Long Beach5,68999.18%470.82%5,736Cannot estimate 34,021
San Bernardino32,83299.24%2510.76%33,083
100,739 180,438
Ventura7,00999.31%490.69%7,05825,537 61,179
Riverside33,86699.47%1800.53%34,046
91,722 181,235
CLPPB (including unknown jurisdictions)21
100.00%0
0.00%
21
Cannot estimate Cannot estimate
California Totals473,81398.52%7,1411.48%480,954

1,354,097

2,922,681

Notes for BLL data:

  • Data are from the RASSCLE surveillance database archive of 4/3/2019. Analysis was completed on 12/11/2019.
  • Each individual is counted only once, using their highest BLL during 2018.
  • Measures are in mcg/dL of whole blood and include arterial, cord, venous, capillary and unknown samples. Not all elevated capillary samples are confirmed by a follow-up venous sample.
  • Results later determined to be false positive and errors have been excluded.
  • All results of blood lead analyses are reportable under California law, and the State works to ensure complete reporting. Results that are not submitted to the State, however, would not be included here.
  • Those BLLs reported from the analyzing laboratory as "<5 mcg/dL" are included in the category "BLL <4.5 mcg/dL."
  • If an individual moved between two jurisdictions, then the child's jurisdiction at the time of their highest BLL is the one counted. 
  • Patient jurisdiction is determined by geocoding the address associated with the child's highest BLL and spatially joining it to a jurisdiction boundary layer. This analysis used the Web Mercator Auxiliary Sphere projection.
  • Data are suppressed for local health jurisdictions that did not have enough blood lead tests in 2018 to meet the California Health and Human Services Agency's Data De-Identification Guidelines for public release. Therefore, not all jurisdictions are shown in this table.
  • Notes for estimates of number of children on Medi-Cal and number of children under 6 in California for 2018:
  • The estimate of the number of children under 6 was based on the California Department of Finance County Population Projections by Age. We also created estimates for the following cities: Berkeley, Long Beach, and Pasadena,
  • The estimate of the number of children on Medi-Cal in 2018 were based on the percentage of under 6-year-olds that are on Medicaid were based on the 2013-2017 American Community Survey (ACS; 5-Year Estimates).
  • The smallest geographic areas in the available ACS data were Public Use Microdata Areas (PUMAs). Since PUMAs must contain at least 100,000 people, some counties are grouped together in one PUMA. Therefore, we do not have estimates for several individual counties. We did not try to create estimates for the following cities: Berkeley, Long Beach, and Pasadena.
  • For some of the smaller geographies, we have less certainty of the percentage. Confidence intervals were calculated but are not shown in the table.

Percent of children under 6 with a BLL of 9

Data are suppressed for local health jurisdictions that did not meet the California Health and Human Service Agency's Data De-Identification Guidelines for public release. 

Suppressed jurisdictions include Alpine, Amador, Calaveras, Colusa, Del Norte, Glenn, Inyo, Lake, Lassen, Mariposa, Mendocino, Modoc, Mono, Nevada, Plumas, San Benito, Sierra, Siskiyou, Sutter, Tehama, Trinity, Tuolumne, and Yuba.

  • Data are from the RASSCLE surveillance database archive of 4/3/2019.
  • Each individual is counted only once, using their highest blood lead level (BLL) during 2018.
  • Measures are in mcg/dL (micrograms per deciliter) of whole blood and include arterial, cord, venous, capillary and unknown samples. Not all elevated capillary samples are confirmed by a follow-up venous sample.
  • Results later determined to be false positive and errors have been excluded.
  • All results of blood lead analyses are reportable under California law, and the State works to ensure complete reporting. Results that are not submitted to the State, however, would not be included here.
  • Those BLLs reported from the analyzing laboratory as "< 5 mcg/dL" are included in the category "BLL < 4.5 mcg/dL".
  • If an individual moved between two jurisdictions, then the child's jurisdiction at the time of their highest BLL is the one counted.  
  • Patient jurisdiction is determined by using a geocoded county boundary layer i.e. the X and Y coordinates projected using Web Mercator Auxiliary Sphere 1984.
  • Refer to Table 2 for data table.

Table 2. California Local Health Jurisdictions, by Percent of Children Under 6 Years Old with a Blood Lead Level of 9.5 mcg/dL or Greater, in Descending Order, 2018

Local Health JurisdictionBLL < 9.5 nBLL < 9.5 % (row)BLL ā‰„9.5 nBLL ā‰„9.5 % (row)Totals
Humboldt1,808
99.01%180.99%1,826
Sacramento14,92199.14%1300.86%15,051
El Dorado53999.45%3
0.55%
542
Shasta54299.45%30.55%545
Yolo2,27299.52%110.48%2,283
Solano4,58599.54%210.46%4,606
Fresno15,54199.58%660.42%15,607
Monterey7,45699.56%330.44%7,489
San Francisco8,18299.61%320.39%8,214
Suppressed jurisdictions8,65499.61%340.39%8,688
Alameda16,24599.62%620.38%16,307
Santa Clara18,75099.63%690.37%18,819
Marin1,69999.65%60.35%1,705
Santa Cruz2,25299.65%80.35%2,260
Stanislaus7,55799.66%260.34%7,583
Contra Costa7,14799.67%240.33%7,171
Kern17,25499.68%560.32%17,310
San Mateo6,03899.69%190.31%6,057
Kings2,24899.69%70.31%2,255
San Joaquin10,54799.71%310.29%10,578
Pasadena1,37199.71%40.29%1,375
Tulare5,80999.73%160.27%5,825
San Diego39,07499.74%1020.26%39,176
Madera3,95299.75%100.25%3,962
Santa Barbara4,55299.76%110.24%4,563
San Luis Obispo1,28899.77%30.23%1,291
Los Angeles141,71399.78%3100.22%142,023
Imperial4,51599.78%100.22%4,525
Sonoma2,80799.79%60.21%2,813
Placer99599.80%20.20%997
Orange32,36599.81%610.19%32,426
Long Beach5,72699.83%100.17%5,736
Berkeley62699.84%10.16%627
Ventura7,04899.86%100.14%7,058
Merced3,77199.87%50.13%3,776
San Bernardino33,04199.87%420.13%33,083
Napa90099.89%10.11%901
Butte1,83299.89%20.11%1,834
Riverside34,02099.92%260.08%34,046
CLPPB21100.00%00.00%21
California Totals479,66399.73%1,2910.27%480,954
  • Data are from the RASSCLE surveillance database archive of 4/3/2019.
  • Each individual is counted only once, using their highest BLL during 2018.
  • Measures are in mcg/dL of whole blood and include arterial, cord, venous, capillary and unknown samples. Not all elevated capillary samples are confirmed by a follow-up venous sample.
  • Results later determined to be false positive and errors have been excluded.
  • All results of blood lead analyses are reportable under California law, and the State works to ensure complete reporting. Results that are not submitted to the State, however, would not be included here.
  • If an individual moved between two jurisdictions, then the child's jurisdiction at the time of their highest BLL is the one counted. 
  • Patient jurisdiction is determined by geocoding the address associated with the child's highest BLL and spatially joining it to a jurisdiction boundary layer. This analysis used the Web Mercator Auxiliary Sphere projection.
  • Data are suppressed for local health jurisdictions that did not have enough blood lead tests in 2018 to meet the California Health and Human Services Agency's Data De-Identification Guidelines for public release. However, the California Totals include the data from suppressed jurisdictions. Suppressed jurisdictions include Alpine, Amador, Calaveras, Colusa, Del Norte, Glenn, Inyo, Lake, Lassen, Mariposa, Mendocino, Modoc, Mono, Nevada, Plumas, San Benito, Sierra, Siskiyou, Sutter, Tehama, Trinity, Tuolumne, and Yuba.

Page Last Updated :