For additional information see
the Blueprint Home Page.
Vaccine Equity Metric
The State has focused on saving lives and protecting its communities during the public health emergency. California implemented the Blueprint for a Safer Economy on August 30, 2020 to reduce COVID-19 in the state with criteria for loosening and tightening restrictions on activities. Every county in California is assigned to a tier based on its test positivity and adjusted case rate for tier assignment. Additionally, a health equity metric took effect on October 6, 2020. In order to advance to the next less restrictive tier, each county must meet an equity metric or demonstrate targeted investments to eliminate disparities in levels of COVID-19 transmission, depending on its size. The California Health Equity Metric is designed to help guide counties in their continuing efforts to reduce COVID-19 cases in all communities and requires more intensive efforts to prevent and mitigate the spread of COVID-19 among Californians who have been disproportionately impacted by this pandemic.
The pandemic in California has not affected all communities equally. Forty percent of COVID cases and deaths occur in our lowest Vaccine Equity Metric Quartile, which combines Healthy Places Index (HPI) scores at ZCTA with CDPH-derived ZCTA scores (CDZS). California believes that equitable vaccine administration is a crucial tool to safely and effectively increasing economic activity. By proactively preventing transmission and protecting the most hard hit and vulnerable groups, we have a better chance of moving through the pandemic as a state.
A heightened ability to protect individuals in these disproportionately impacted communities not only improves health in those communities but has critical impacts on the state as a whole, including:
Reduced stress on the hospital system through reduced hospitalizations among populations that often have higher levels of underlying risk from chronic illnesses and/or structural factors associated with crowded housing conditions and exposures that are not easy to avoid.
Reduced general transmission of the virus through reduced transmission between close household or other community members in communities where we have historically seen the highest levels of test positivity and case rates compared to communities in the Vaccine Equity Quartiles.
Reduced likelihood of the threat of variants as variants depend on high levels of community transmission to emerge, spread, and dominate.
Reduced threat of vaccine escape (when a virus develops partial or full vaccine resistance). The full and timely vaccination of individuals reduces the risk of high levels of transmission commensurate with higher levels of mutation and the potential for mutations that are resistant, in whole or in part, to a given vaccine.
For all of these reasons, California's approach to modifying the Blueprint for a Safer Economy is anchored not just on the level of overall vaccinations across California but with a particular focus on vaccinating individuals living in the state's Vaccine Equity Quartile communities as a critical indicator of the ability to expedite protection and disease transmission prevention to all communities in the state.
As of March 4, 2021, the Blueprint for a Safer Economy has been updated to reflect full swing vaccination efforts in California with the goal of achieving community immunity.
Modifications to the Blueprint will primarily include two approaches: (1) shifting the tier threshold to higher case rates per 100K population per day based on meeting vaccination thresholds within Vaccine Equity Quartile communities and; (2) changing certain sector specific guidance and issuing new sector guidance to incorporate learnings from the last year about how the virus spreads.
Statewide Vaccine Equity Metric Goal #1:
Purple (Widespread) tier will shift from greater than 7 cases per 100,000 to greater than 10 cases per 100,000; and the Red (Substantial) tier will be widened to 4-10 cases per 100,000 when:
- 2 million doses have been administered to persons living in the Vaccine Equity Quartile. (assessed statewide).
Orange (Moderate) and Yellow (Minimal) tier ranges will remain the same.
Statewide Vaccine Equity Metric Goal #2:
Purple (Widespread) tier threshold will remain at greater than 10 cases per 100,000, Red (Substantial) tier case rate range will narrow to 6-10 cases per 100,000; and the Orange (Moderate) tier case rate range will shift to 2-5.9 cases per 100,0000. The Yellow (Minimal) tier case rate range will shift to less than 2 cases per 100,000 when:
- 4 million doses have been administered to persons living in the Vaccine Equity Quartile (assessed statewide).
Blueprint Tier Framework Thresholds Upon Meeting Statewide Vaccine Equity Metric Goals

The day a Vaccine Equity Metric goal has been met, tier assignments will be revised to reflect the shift in Blueprint tier thresholds shifts. Updated tier assignments will be effective two days after tier assignments are announced.
Plan for Reducing COVID-19 and Adjusting Permitted Sector Activities to Keep Californians Healthy and Safe
This guidance outlines a framework for a safe progression of opening more businesses and activities in light of the pandemic. The framework for this guidance is informed by increased knowledge of disease transmission vulnerabilities and risk factors and is driven by the following goals:
To progress in phases based on risk levels with appropriate time between each phase in each county so impacts of any given change can be fully evaluated.
To aggressively reduce case transmission to as low a rate as possible across the state so the potential burden of COVID-19 does not challenge our healthcare delivery system's ability to surge with space, supplies and staff; and to prevent the emergence and transmission of variants of the disease, including those resistant to vaccines.
Tier Framework
This framework lays out the measures that each county must meet, based on indicators that capture disease burden, testing, and health equity. A county may be more restrictive than this framework. This framework also notes signals of concern, including impacted healthcare capacity that may lead towards a dimming intervention. This framework replaces the former County Data Monitoring metrics. As the COVID-19 pandemic continues to be an evolving situation and new evidence and understanding emerges, the California Department of Public Health (CDPH), in collaboration with other State officials, will continue to reassess metrics and thresholds.
See chart below for the framework metrics as set according to tiers based on risk of community disease transmission. As of March 13, 2021, thresholds for the tiers will be updated in the table below once statewide vaccine equity goals are met. Calculation of metrics is described in Appendix 1. Description of the Health Equity Metric can be found on the Health Equity Metric page.
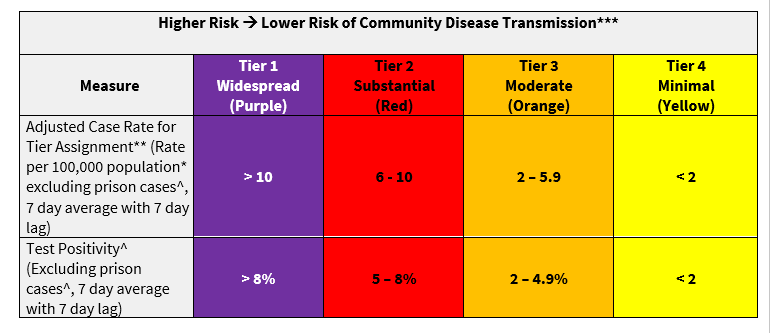
Metrics with values greater than or less than tier cut points by 0.05 are rounded up or down using conventional rounding rules.
^Excludes state and federal inmates, ICE facility residents, State Hospital inmates and US Marshal detainees
*Population denominators from the Department of Finance: State Population Projections - Total Population by County- Table P-1
**Case rate will be determined using cases confirmed by PCR
*** Counties are assigned a tier based on two metrics: test positivity and case rate. Large counties with populations greater than approximately 106,000 must also meet the health equity metric described on the Health Equity Metric page in order to advance to a less restrictive tier.
The case rate is adjusted based on testing volume per 100,000 population as described below. Due to variability in data, this adjustment does not apply to small counties (defined as those with a population less than 106,000 residents).
As counties focus on increased testing in their health equity quartiles and to support school openings, they are likely to experience an increased number of cases. We want to avoid disincentivizing increased testing, provided that test positivity is low and there is sufficient capacity for contact tracing and isolation. We are therefore increasing the adjustment for higher volume testing.
For counties with testing volume above the state median, the factor is less than 1, decreasing in a linear manner from 1.0 to 0.5 as testing volume increases from the state median to 2x the state median. The factor remains at 0.5 if the testing volume is greater than 2x the state median.
For counties with testing volume below the state median, the factor is greater than 1, increasing in a linear manner from 1.0 to 1.4 as testing volume decreases from the state median to zero. However, this adjustment for low testing volume will not be applied to counties with a test positivity < 3.5%.
California COVID-19 Case Rate Adjustment Factor
|
Testing Volume |
Case Rate Adjustment Factor* |
| 0 | 1.4 |
| 0.25* State Median | 1.3 |
| 0.50* State Median | 1.2 |
| 0.75* State Median | 1.1 |
| State Median | 1 |
| 1.25* State Median | 0.875
|
| 1.5* State Median | 0.75
|
| 1.75* State Median | 0.625
|
| 2.0*State Median and above | 0.5
|
Counties with fewer than 106,000 residents, will be exempted from case rate adjustments, and counties with test positivity <3.5% will be exempted from adjustment for testing rates lower than the state median.
Moving through the Tiers
Rules of the framework:
CDPH will assess indicators weekly on Mondays and release updated tier assignments on Tuesdays.
A county must remain in a tier for a minimum of three weeks before being able to advance to a less restrictive tier.
A county can only move forward one tier at a time, even if metrics qualify for a more advanced tier.
The health equity metric is applied to jurisdictions with populations greater than 106,000. Rules of the health equity metric are described on the Health Equity Metric page.
City local health jurisdiction (LHJ) data will be included in overall metrics, and city LHJs will be assigned the same tier as the surrounding county
An LHJ may continue to implement or maintain more restrictive public health measures if the local health officer determines that health conditions in that jurisdiction warrant such measures.
Tier status goes into effect the Wednesday following each weekly tier assignment announcement on Tuesdays.
Once statewide vaccine equity goals are met, determination of the number of weeks a county has accumulated towards movement to a more or less restrictive tier follows the framework that is in place at the time of tier assessment. For example, if a county had a case rate of 8 per 100,000 and test positivity < 8% for 2 weeks prior to the time when the Goal 1 thresholds are met, the county will be eligible to move to the Red Tier.
To advance:
A county must have been in the current tier for a minimum of three weeks.
A county must meet criteria for movement to the next less restrictive for the prior two consecutive weeks in order to progress to the next tier; which can be achieved by either or combination of criteria described below:
Meeting the Adjusted Case Rate, Test Positivity, and Health Equity metric criteria for a less restrictive tier. For small counties with a population less than 106,000, Adjusted Case Rate and Test Positivity will be used for the default assessment. If a small county does not meet the adjusted case rate to earn a week towards a less restrictive tier (but does meet the test positivity criteria), CDPH will review absolute new case counts, and whether vaccine administration coverage in the county within or equal to 5% (absolute value) of the statewide average. More information can be found under the Small County Framework section.
Meeting the criteria for movement to the next less restrictive tier through health equity accelerated progression.
To move back:
During the weekly assessment, if a county's adjusted case rate and test positivity have fallen within a more restrictive tier for two consecutive weekly periods, the state will review the most recent 10 days of data, including hospitalization data, and if CDPH determines there are objective signs of stability or improvement the county may remain in the tier. If the county’s most recent 10 days data does not show objective signs of stability or improvement the county must revert to the more restrictive tier. For subsequent weekly assessments, the above rules apply.
At any time, state and county public health officials may work together to determine targeted interventions or county wide modifications necessary to address impacted hospital capacity and drivers of disease transmission, as needed, including movement across more than one tier. Key considerations will also include the rate of increase in new cases and/or test positivity, more recent data as noted above, vaccination rates, public health capacity, and other epidemiological factors.
Counties with a population less than 106,000 will have a small county case assessment criteria applied to it to ensure movement to a more restrictive tier is appropriate. More information can be found under the Small County Framework section.
Counties will have three days, beginning the Wednesday after tier assignments are announced on Tuesdays, to implement any sector changes or closures unless extreme circumstances merit immediate action.
Because California's case rate metric is normalized per 100,000 population, a number of counties with small populations have experienced large swings in their daily case rate as a result of a small number of newly reported cases. For some counties, this has raised the specter of needing to move back to a more restrictive tier despite overall disease stability and a demonstrated ability to trace, follow up with, investigate and support cases.
For example, once a small county is in yellow tier, a small number of cases – as low as 1 case per week for 2 consecutive weeks – could cause it to return to a more restrictive tier. While the overall proportion of cases may be the same as a larger county, the absolute number of cases is also an important consideration in gauging county capacity to control transmission through disease investigation, contact tracing and supportive isolation.
It is not in the interest of the public health of communities to close or restrict entire business sectors on the basis of such a small number of cases, and in some situations a small swing in week over week case counts can move a county from yellow tier all the way to purple tier. Because the State wants to avoid swift shifts in tier status based on small absolute case number changes, we created a small county case assessment measure to apply to small counties. As of April 20, 2021, CDPH will also consider absolute new case numbers and vaccine coverage to determine if a county may move to a less restrictive tier should the default assessment of adjusted case rate preclude it from acquiring a week towards a less restrictive tier or movement. Small counties are defined as having fewer than 106,000 residents.[1]
Small County Case Assessment Measure
Small counties are subject to all existing Blueprint rules (test positivity thresholds, minimum duration of 3 weeks in a tier before moving to a less restrictive tier, inability to skip over a tier while moving from more restrictive to less restrictive tier designations, etc.).
The small county case assessment measure provides a small county protection against sudden tier changes as a result of small increases in cases or the ability to move to a less restrictive tier.
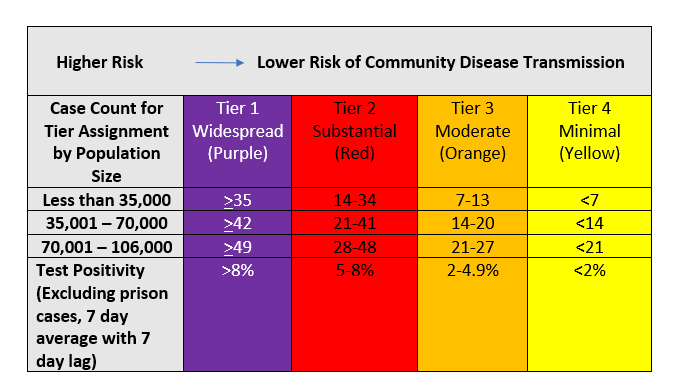
For a small county that meets test positivity criteria but does not meet adjusted case rate criteria for a less restrictive tier, the following absolute new case counts by county size and test positivity will be used. If a county meets absolute case count criteria and test positivity, CDPH will also review county level vaccine coverage to determine if the county is vaccinating within or equal to 5% (absolute value) of the statewide average vaccine coverage to make the final tier assignment.
Vaccine coverage rate for small counties is defined as vaccine administration rate with individuals who have received at least one dose, including one dose of Janssen vaccine.
[1] Twenty-two California counties have a population of less than 100,000. Sutter, which has a population of 106,000 is also included as it shares a health officer with Yuba County. Counties below this size have similar challenges and opportunities in controlling COVID-19 transmission and generally do not have major or large, densely populated cities. This distinction factors into how rapidly COVID-19 transmission can increase beyond households and the ability of the county to rapidly identify and contain outbreaks with existing contact tracing, isolation and quarantine resources.
Risk Criteria
Activities and sectors will begin to open at a specific tier based on risk-based criteria (PDF), as outlined below. Lower risk activities or sectors are permitted sooner and higher risk activities or sectors are not permitted until later phases. Many activities or sectors may increase the level of operations and capacity as a county reduces its level of transmission.
Criteria used to determine low/medium/high risk sectors
Ability to accommodate face covering wearing at all times (e.g. eating and drinking would require removal of face covering)
Ability to physically distance between individuals from different households
Ability to limit the number of people per square foot
Ability to limit duration of exposure
Ability to limit amount of mixing of people from differing households and communities
Ability to limit amount of physical interactions of visitors/patrons
Ability to optimize ventilation (e.g. indoor vs outdoor, air exchange and filtration)
Ability to limit activities that are known to cause increased spread (e.g. singing, shouting, heavy breathing; loud environs will cause people to raise voice)
Schools
Schools may reopen for in-person instruction based on equivalent criteria to the
K-12 School Guidance. Schools in counties within the Purple Tier are not permitted to reopen for in-person instruction, with exceptions outlined in the
K-12 School Guidance. See the guidance and the
K-12 Schools FAQ for additional information on school re-opening eligibility criteria under the Blueprint.
As stated in the
K-12 School Guidance, schools are not required to close if a county no longer meets relevant school re-opening criteria (e.g., goes from Red Tier to Purple Tier or has adjusted county case rates ≥25/100,000 population) but may consider increasing testing per the CDPH supported testing
framework.
County Tier Adjudication Process
For more information, visit our County Tier Adjudication Request page.
APPENDIX 1: Calculation of metrics
|
Case Rate (rate per 100,000 excluding prison cases, 7-day average with 7-day lag) | Calculated as the average (mean) daily number of COVID-19+ cases, this excludes: (a) persons out of state or with unknown county of residence and (b) persons incarcerated at state or federal prisons, ICE facilities, US Marshal only detention facilities or Department of State Hospitals (identified as cases with an ordering facility name or address associated with these locations), over 7 days (based on episode date), divided by the number of people living in the county/region/state. This number is then multiplied by 100,000. Due to reporting delays, there is a 7-day lag built into this calculation. For example, for data updated through 8/22/20, the case rate will be dated as 8/15/20 and will include the average case rate from 8/9/20 - 8/15/20. |
Linear adjusted case Rate per 100,000 per day, excluding prisoners (7-day average with 7-day lag) | Calculated as the case rate multiplied by a case rate adjustment factor that is based on the difference between the county testing volume (testing volume, tests per 100,000 per day, described below) and the median county testing volume calculated across all counties. The median testing volume thus forms an anchor for this adjustment and is recalculated every week to account for evolving testing trends. For counties with a testing volume above the median, the adjustment factor is less than 1, decreasing in a linear manner from 1.0 to 0.5 as testing volume increases from the anchor point to 2x that value. The adjustment factor remains at 0.5 if the county testing volume is greater than 2x the state median. For counties with a testing volume below the state median, the adjustment factor is greater than 1, increasing in a linear manner from 1.0 to 1.4 as county testing volume decreases from the state median to zero. The linear adjustment formula can be expressed mathematically as follows:
For counties testing above the state median:
1-(((county testing rate – state median testing rate)/state median testing rate) * 0.5) For counties testing below the state median: 1-(((county testing rate – state median testing rate)/state median testing rate) * 0.4)
There are two conditions in which this formula is not applied. The first is small counties, those with a population less than approximately 100,000 based on CA Department of Finance population projections (see reference * in tier framework table). The small county exception prevents potential spurious adjustment due to fluctuations in testing influenced by secular events unrelated to underlying transmission risk. As a second condition for exception from the adjustment, counties with a testing volume below the state median and testing positivity < 3.5% are not adjusted, based on the assumption that volume of testing in these counties may not need to be as high with low test positivity. Under both these conditions, the adjusted case rate is equal to the unadjusted rate.
|
Overall testing Positivity, excluding prisoners over 7-days (PCR only, 7-day lag)
| Calculated as the total number of positive polymerase chain reaction (PCR) tests for COVID-19 over a 7-day period (based on specimen collected date) divided by the total number of PCR tests conducted; this excludes tests for: (a) persons out of state or with unknown county of residence and (b) persons incarcerated at state or federal prisons, ICE facilities, US Marshal only detention facilities and Department of State Hospitals (identified as cases with an ordering facility name or address associated with prison/state hospitals locations). This number is then multiplied by 100 to get a percentage. Due to reporting delay (which may be different between positive and negative tests), there is a 7-day lag.
Example: For cumulative lab data received on 6/30/20, reported test positivity is dated as 6/23/20 and is calculated based on tests with specimen collection dates from 6/17-6/23
|
Tests per 100,000 per day, excluding prisoners (7-day average with 7-day lag) | Calculated as the number of polymerase chain reaction (PCR) tests per day over a 7-day period (based on specimen collection date), excluding tests for persons incarcerated at state or federal prisons, ICE facilities, US Marshal only detention facilities and Department of State Hospitals (identified as cases with an ordering facility name or address associated with prison/state hospitals locations), and divided by the number of people living in the county/region/state. This number is then multiplied by 100,000. Due to reporting delay, there is a 7-day lag included in the calculation. Example: For cumulative lab data received through 8/22/20, the reported 7-day average number of tests will be dated as 8/15/20 and will include PCR tests with specimen collection dates from 8/9/20 - 8/15/20.
|
Data Source: CalREDIE